If you’re a mail shop or agency, you already know the truth: Direct mail works.
But in today’s marketing environment – where performance is measured in dashboards, tracked in real time, and evaluated with precision – that’s no longer enough.
Your clients want more than impressions and delivery confirmations. They want answers. They want insight. They want proof.
That’s where Mailresponse comes in.
We built ResponseIQ to close the gap between traditional mail and modern marketing expectations. It’s not just another tracking tool. It’s a performance platform that helps mailshops and agencies deliver smarter campaigns, prove results, and build longer-lasting client relationships – without investing in new equipment or changing how they mail.
📺 Watch the quick demo above? Great. Now here’s everything else you need to know.
What ResponseIQ Is – and What It’s Not
Let’s be clear: ResponseIQ is not just a mail tracking system.
Solutions like SnailWorks or Informed Visibility are great at telling you when a mailpiece was delivered. And that’s useful — but it’s not the full picture. It’s like knowing your email campaign was sent but having no idea whether anyone opened it, clicked it, or converted.
That’s where ResponseIQ comes in.
We take you beyond delivery — giving you insight into what happens after the mail hits the mailbox.
We go beyond delivery, helping you:
- Track real-time engagement and response
- Attribute results to specific creatives, channels, and devices
- Compare performance across offers, geographies, and audiences
- Give clients the ability to see live data under your brand
Want a deeper dive into how we compare to SnailWorks? Read our full breakdown here →
How ResponseIQ Works (Step-by-Step)
Step 1: Upload the Mail File
You start by sending us the data file for an upcoming campaign – typically a CSV or Excel file with recipient names, addresses, and any other personalization fields you’d like to use (such as location, offer type, or customer segment).
You can upload your data securely via FTP, or if you work with a third-party data vendor we can accept files directly from them to make your workflow even more seamless.
ResponseIQ doesn’t just accept your data, we clean it, append it, and prepare it for smart tracking.
We automatically generate:
- PURLs – Personalized URLs for each recipient, unique and trackable.
- QR Codes – Optional, scannable codes linked directly to their PURL.
- Metadata fields – So you can later sort and report by any variable included in the file (like creative, geography, or demographic info).
This setup is the foundation for everything ResponseIQ delivers next: personalized engagement, trackable performance, and actionable insight – all powered by your campaign data.
➡️ Curious about the quality of the data you’re receiving from your vendors? We’re publishing an article on how to spot discrepancies between purchased data and real-world user input. Stay tuned or subscribe to get notified when it’s live.
Step 2: We Generate Personalized URLs (PURLs)
Every recipient gets a unique, trackable PURL – a Personalized URL – that leads them to a custom landing page built just for them. These URLs are printed directly on each mailpiece and can be accessed via typed link or QR code.
Each PURL landing page is designed to feel hyper-personalized and relevant, using dynamic fields such as the recipient’s name, location, or even a specific offer that was assigned in the data file.
The moment a recipient visits their PURL or makes a call associated with their record, ResponseIQ begins tracking their behavior – feeding that information into your dashboard in real time.
Want to take the experience further? You can:
- Track form submissions, button clicks, and conversion actions
- A/B test different versions of your landing pages
- Route responses to sales teams or CRMs based on location, time of day, or lead quality
The PURL is the bridge between physical mail and digital engagement – and ResponseIQ turns that bridge into a real-time data stream that empowers your team and your clients to act on insights instantly.
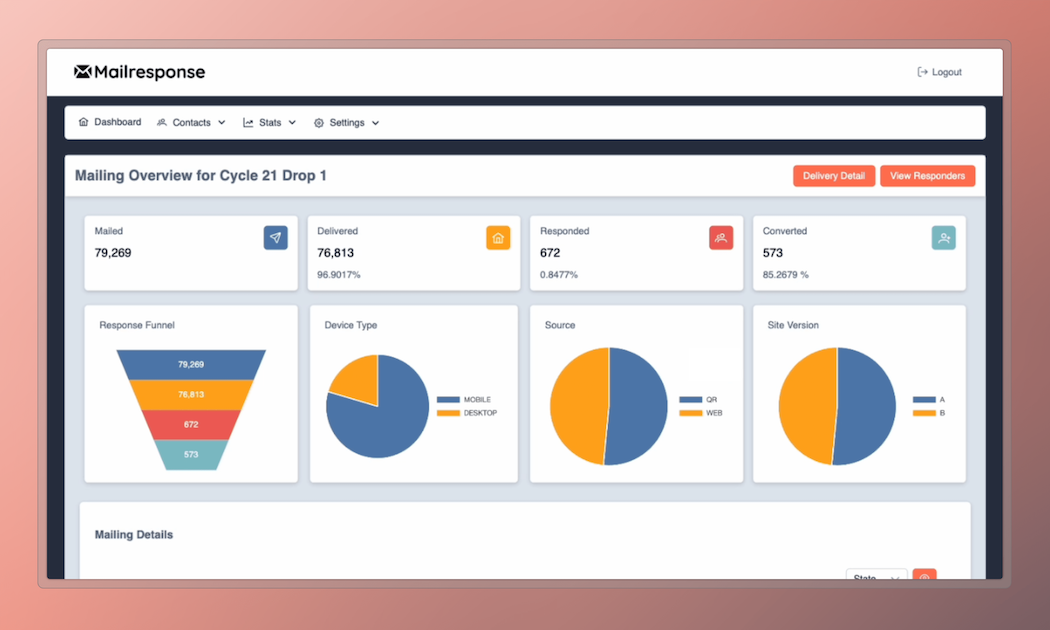
Step 3: You See Real-Time Engagement in the Control Panel
Now you’re seeing real-time, actionable data at both the campaign and individual recipient level:
- Which recipients are engaging – Instantly know who visited their PURL, who scanned the QR code, and who placed a call.
- Which offers they saw – Tie each response back to a specific offer or message to understand what’s resonating.
- What channels they used – Distinguish whether responses came through QR scans, direct URL entries, phone calls, or even follow-up emails.
- Where they’re located – View response trends geographically, helping you optimize future mailings by region.
- What creative drove their response – Compare individual creatives, formats, and copy variations to uncover what works best.
With this level of transparency, you’re not just monitoring – you’re managing campaigns in real time. This dashboard becomes your live campaign intelligence center, giving your internal teams the insight they need while offering clients a branded portal where they can view results, drill down by segment, and take action on the data without delay.
Step 4: Test Offers, Creative, and Messaging
When you’re running multiple versions of a mailer, whether it’s testing two headlines, a special offer, or even different images, understanding which version performs best can be the difference between an average campaign and a highly profitable one.
Want to know whether the 0% APR offer outperforms the $750 off offer? You don’t need to guess.
Just filter your dashboard to compare performance in real time. You’ll see which creative is generating more clicks, more calls, and more conversions – not only by total volume but also by location, channel, and device.
Now your account managers can:
- Report what worked, backed by real-time engagement data
- Recommend what to test next – or what to double down on
- Build client trust by presenting proof, not assumptions
- Report what worked
- Recommend what to do next
- Build trust by showing real results
Step 5: Add Context with Relative Data
Many tools only show you raw response numbers. But raw data without context can be misleading – especially when your client is running a geographically diverse campaign with different mail volumes across regions.
For example, say you’re a mailshop helping a client launch a national campaign across all 50 states – including smaller markets like Hawaii. On the dashboard, you notice that Hawaii only generated 38 responses. At first glance, that might look underwhelming – until you realize only 200 pieces were mailed there.
That’s a 19% response rate – far outperforming a state like California, which may have had 20,000 mailers and 1,200 responses – a much lower relative rate.
With ResponseIQ, you can toggle between:
- Absolute response – The raw number of responses received.
- Relative response – The percentage of responses based on total pieces mailed to each region.
This gives you and your clients a far more accurate picture of where campaigns are succeeding – and where there’s room to grow.
This feature is especially powerful for:
- Franchise systems comparing location performance
- Regional rollouts testing new markets
- National campaigns managing segmented audience groups
Step 6: Share Branded, Actionable Reports
Your team can use the dashboard – but even better, so can your clients.
With ResponseIQ, you can:
- White-label the dashboard with your branding
- Customize report views based on any client-relevant field (region, offer, audience, or any data point you provide)
ResponseIQ is powered by your original data file – which means if it’s in the file, it can be turned into a report. Want to group results by sales territory? Track conversions by product tier? Compare performance by credit score, campaign ID, or source type? No problem.
Our system gives you and your clients the flexibility to view results exactly the way they want to see them – even across highly segmented or complex campaigns. - Export everything for easy client-facing presentations and stakeholder meetings
This turns you from a production partner into a strategic advisor. Instead of sending over static spreadsheets or post-campaign summaries, you’re delivering a live reporting experience that your clients can explore, filter, and use to make real business decisions.
You’re no longer just fulfilling a print job – you’re equipping your clients with the tools, insights, and confidence they need to keep mailing, keep optimizing, and keep growing.
Solving Real Problems Mailshops and Agencies Face
Here’s how ResponseIQ helps you go beyond print – and become a strategic growth partner:
For Account Managers:
- Eliminate the manual work of pulling spreadsheets, chasing performance reports, or guessing what worked. With ResponseIQ, everything your clients need to see is visual, exportable, and always up to date.
- Impress clients by proactively surfacing which creatives, offers, or regions are outperforming – and recommend what to double down on.
For Sales Teams:
- Arm your team with more than mail volume stats – give them a story. Demonstrate that your shop doesn’t just deliver mail – it delivers results.
- Use live dashboards to highlight campaign wins in pitch meetings or quarterly reviews – adding credibility and value that keeps clients mailing more.
For Franchise Clients:
- Provide local franchise owners with access to only their own data while allowing regional or national managers to see performance across all markets.
- Easily benchmark campaigns between locations, test regional offers, and track lift across specific territories with toggles for absolute and relative metrics.
For Strategic Agencies:
- Deliver agency-branded dashboards and reports that elevate your service offerings.
- Help clients track ROI by campaign, channel, and audience segment – so your recommendations aren’t just smart, they’re backed by data.
- Become indispensable by proving you don’t just mail – you optimize, analyze, and accelerate performance.Gain a competitive edge with data-backed recommendations that turn you into a true growth partner.
Why It Matters
Direct mail already works. But when you can prove that it’s working – with real-time data, visual reporting, and measurable ROI – everything changes.
When your clients see what’s working, they don’t just mail again – they mail more often, test more offers, and invest more confidently.
And when they trust that you’re giving them more than a print job – that you’re giving them results they can take to their stakeholders – they stay with you.
That’s the core of what ResponseIQ is built to do:
- Help you generate more response from every campaign
- Turn performance data into proof and insight clients can act on
- Elevate your offering from commodity to competitive advantage
ResponseIQ helps you:
- Elevate your role from vendor to partner
- Prove ROI and campaign effectiveness
- Keep clients engaged, mailing, and growing
Next Steps
📺 Watch the video above for a quick overview
📊 Read the SnailWorks vs. ResponseIQ comparison
🗓️ Book your personalized demo today → mailresponse.io
Mailresponse: Because direct mail deserves the same performance tools as every other modern marketing channel.